evaluation

Theory of Change

A ‘Theory of Change’ is exactly what the term says: it is your theory about the change your project is going to create. The useful thing about a Theory of Change is that, instead of prioritising what you want to do, it makes you think about why.

Ask yourself:

What is your big picture goal - your mission, the legacy you want to leave on this planet?

What is known about how to reach that goal?

What can you do, that no one else can, to help reach that goal?

Slide3.jpeg

A Theory of Change has four components, and you should go from right to left.

Slide4.jpeg

Check your assumptions

The arrows in a Theory of Change are possibly the most important part of the whole thinking process. The arrows from an activity to an outcome, from an outcome to an impact and so on, are the CAUSAL ASSUMPTIONS you are making. You are saying if I do x, then y will follow.

But will it? What are you basing this assumption on? Are you basing it on prior research? Check your assumptions. Unpack them. See if they hold up under scrutiny.

Slide5.jpeg

Things to keep in mind about a Theory of Change

  • Develop your theory of change WITH the people you are hoping to benefit through the project. Who do you want to experience the desired impacts? Do they want to experience these impacts? Do the desired impacts vary between groups? See my diversity evaluation resources for more information on ensuring you are actually achieving what you say you want to achieve.

  • Define the goals first, then work backwards

  • Not everything in the Theory of Change has to be measurable. You can choose the most important things to measure. But what you measure should include the key assumptions which might underpin some of your cause-effect thinking

  • Activity = What will achieve our goal + What can we do that no one else can.

I have my Theory of Change. Now what?

A Theory of Change is not an evaluation framework. Once you have your Theory of Change, you can use it to help you decide what impacts (and their underlying assumptions) are most important.

Then you build yourself an Evaluation Framework. Mine normally have three key bits.

Elements of an Evaluation Framework

Evaluation framework elements.gif

This site has detailed steps and examples of each of these three elements of an evaluation framework, and a template for an evaluation framework. Enjoy!

Evaluation - Focus on 'Diversity'

I delivered a webinar for the Diversity Arts Australia Fair Play Program on evaluation with a focus on ‘diversity.’ You can access the slides here. I have copied in the main ones below.

There is also a lot more detail on various aspects of evaluation in the other resources on this website if you want to get into the nitty gritty of developing an impact framework or understanding theory of change.

Evaluation is an exercise in power

When evaluating a project which involves people with lived experience of marginalisation, it’s very important to understand that evaluation is not neutral, but is an exercise in power. It can be an exercise in sharing power, giving it away; or it can be an exercise in entrenching power, and maintaining the status quo.

Slide3.jpeg
Slide4.jpeg

I recommend that before you start the process of evaluation, ask yourself honestly:

Will your evaluation itself make things better or worse for the people you would like to help?

Slide5.jpeg

As a rule of thumb, when you go into evaluation of projects with people with lived experiences of marginalisation, remember your starting point should be: justice, co-design, working with evaluators with lived experience, and ownership.

Slide12.jpeg

When you decide what to evaluate, the most important thing to do is: ask the intended ‘beneficiaries’ of the project. I use quotation marks for ‘beneficiaries’ because it is not necessarily the case that your project is benefiting others more than it is benefiting your own organisation - see above re power.

What do the people, who are the intended beneficiaries of this project, want to see change?

Slide13.jpeg

There are a bazillion ways to collect data. The main ones are: self-assessment, observations (be super careful with these, so you don’t disempower the people you are trying to support), interviews and questionnaires.

I generally recommend questionnaires (which someone asks you) over surveys (which you send out and hope people respond to). This is because people with lived experiences of marginalisation tend to be under-represented in survey responses.

Slide28.jpeg

Play devil’s advocate. Try to prove the opposite of what you hope are the outcomes of your project.

Slide35.jpeg

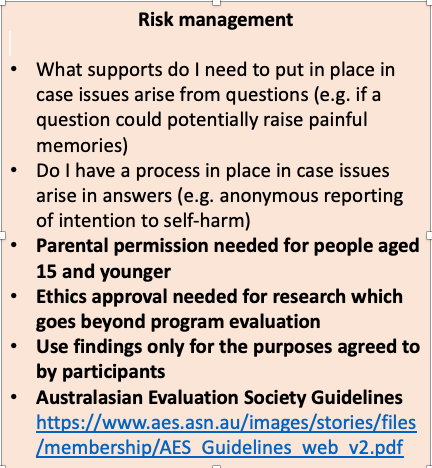
All the way through the evaluation you need to check in on a range of ethical considerations around consent, privacy, risk of harm and power.

Slide40.jpeg

Make sure you have put in place the support people need to respond to your evaluation.

Slide41.jpeg

When you design your tools, make sure you work with ‘critical friends’ who also have lived experience of the forms of marginalisation of the group you are working with. And be prepared to change things.

Slide42.jpeg

We often use a ‘before and after’ tool, which allows people to jot down words or do drawings of how they felt ‘before’ and ‘after’ a project experience.

Slide43.jpeg

I also love Voice Lab by Polyglot, which allowed kids to say what they really felt in a beautiful private cocoon space.

Once you have your data, again try to hand the power over to the people with lived experience of marginalisation.

Slide46.jpeg

Top Tips

Here are my top tips for evaluating projects which involve people with lived experience of marginalisation.

Slide48.jpeg

Values-based planning

I recently delivered a short presentation for the Theatre Network Australia (TNA) as part of a seminar entitled ‘Planning for a future we can’t imagine.’ I am including here a quick overview of the main points:

  • Theory of Change as an impact-driven planning tool

  • Action research as a useful model for iterative planning

  • Values-driven planning

TNA also has a useful bunch of links to other planning tools and resources.

Slide2.jpeg

Theory of Change

Slide3.jpeg

The key to a good Theory of Change is to work backwards from the big picture goal to the activity, rather than the other way around. A Theory of Change has the following elements:

  • Big picture goals - these are your legacy goals, the difference you want your project or organisation to make to the long arc of history

  • Project impacts - these are the medium to long-term impacts that your project or organisation needs to achieve to contribute to the big picture goals

  • Outcomes - these are the intermediate or short-term outcomes that your project or organisation needs to achieve to get to the project impacts

  • Activities - this is what your project or organisation will do to lead to the outcomes.

You decide your activity based on simple equation:

What will lead to the change we want to see?

+

What we can do that no one else can?

For example, I might want to contribute to world peace. To do that, perhaps I should become an international human rights lawyer. But when I tried to do a law degree, I hated it. So what can I do that no one else can? I can write this blog post, for starters - and work in the arts for social change.

Slide4.jpeg

Below is a rough example of what a Theory of Change might look like for an art gallery which wants to support cultural equity and justice.

The useful thing about a Theory of Change are the arrows. The example may look like an electrical circuit diagram but it is essential that you use a Theory of Change to unpack your cause and effect assumptions. Adding the arrows allows you to really critically evaluate:

Will X really lead to Y, or am I basing that on false assumptions, poor research or unconscious bias?

What else do I need to do to make sure X leads to Y?

Who do I need to ask to make sure my assumptions are valid?

Slide5.jpeg

For more details about Theory of Change, go to our dedicated resource. Also thanks to Ian David Moss for schooling me in Theory of Change in the first place.

Action Research

Now let’s turn to action research. This is the term given to a cycle of observe, reflect, plan and act. You may have heard this called all sorts of things:

  • In the innovation field this is called the fast fail model

  • In design it might be called beta testing or design-led thinking

  • In business it is called agile project management

In essence, it just means:

  • Do something (‘Act’)

  • See how it goes (‘Observe’)

  • Ask yourself and others what worked, and what needs to be done differently (‘Reflect’)

  • Get ready (‘Plan’)

  • Do something a bit different this time (‘Act’)

  • etc

Slide6.jpeg

Values-Based Planning

‘Values-based’ or ‘values-driven’ planning is about checking in with your values, rather than your KPIs or immediate metrics, to make sure you are on track. It is a useful grounding exercise, to being you back to what you really believe in and the change you want to see in the world as a result of your existence.

Values-based planning is super useful for individuals and organisations, and is something I do in general, with my life.

For an organisation, checking in with values makes sure you are not working your tail off to achieve what Vu Le calls the organisation’s ‘shadow mission.’ For example, you may have set up your organisation wanting kids to experience live music. In a Theory of Change, this is actually an outcome - not a goal.

Big picture goal: Kids have access to a source of replenishable joy throughout their lives.

Impact: Kids aged Y in X neighbourhood know where to find music and how to enjoy it.

Outcomes: Kids have access to live music experiences; kids enjoy the experiences; the experiences are accessible; the venue and logistics all work well.

Activity: Set up live experiences of music for kids [from X neighbourhood and Y age range); work with schools and families to make sure kids can get there (e.g. look at transport, timing, costs)

If you understand this, then you can stay focused on the big picture goal.

But what often happens is, your organisation becomes focused on building its brand, or fundraising, or beating competitors.

Over time, instead of being about helping kids access joy, most of your activities seem to become focused on organisational survival, and fighting with other organisations which have the same mission, over resources.

Slide7.jpeg

Values-driven planning is about checking in and challenging yourself and your organisation.

Identify

  • What are your values? Be honest and specific! For example, I might say my values are cultural equity and justice, but are they really? Or as a writer and a woman, are my values actually ‘cultural equity and justice for women of colour working in literature?’

  • For example, you might say your values are to help people experience the joy you experience when you see theatre. Which is lovely. But let’s unpack it. There are two potentially conflicting goals here: joy for people, and theatre. They might not go together for everyone, so get specific.

  • Also - which people? If your organisation ends up with a price point for its activities too high for the majority of society, then you have to acknowledge that your organisation is actually delivering ‘the joy of theatre experiences for the wealthiest people in my city.’ Which may not be where you started, or what you value. So that means you have to challenge what you are doing.

Ask

  • Who do you need to ask to make sure what we want to do matches what we say we value?

  • For example, if I say I am all about cultural equity and justice for people of marginalised identities, I need to bring on people of marginalised identities into ownership, planning and decision-making. Otherwise I am just feathering my own nest. If your organisation says it wants to help, say, First Nations Australians access employment opportunities, then you have to have as a goal the transfer of power and ownership to First Nations Australians. Otherwise your ‘shadow mission’ starts to take over, and instead of transferring power, you start to hoard it for your organisation’s survival.

Design

  • Co-design activities which will enact your values. Again this is about making sure that, if you have social change goals, you centre the people you want to support.

Act

  • You implement the activities - again centring the people you want to support in delivering your activities.

Measure and reflect

  • Check in. Are your activities actually achieving your values? Or are there unintended or unforeseen consequences that are not achieving your values - may even be undermining your values?

  • For example, I once worked with an organisation which wanted to support better understanding and safety for people of marginalised identities, via online videos marketed to the general public. But these videos generated so much Internet vitriol that the project was unsafe for the intended beneficiaries.

Change

  • Make changes to meet core values. In the example above, the organisation ‘pivoted,’ shifting the target audience to other people of marginalised identities who could create a wider, safe community for the target beneficiaries.

Tips for writing an evaluation report

How do you report on your results?

As part of your evaluation, you will need to pull everything together in a report.  By this stage, you will have your evaluation framework in place and developed some data collection tools e.g. you may have interviewed people, observed them or surveyed them etc.

The data is in and you’ve spent some time analysing and trying to make sense of it all.

Now you need to write it all up.  Where to begin?

I use the following simple structure for reporting which you may find useful, particularly if you are doing it for the first time. 

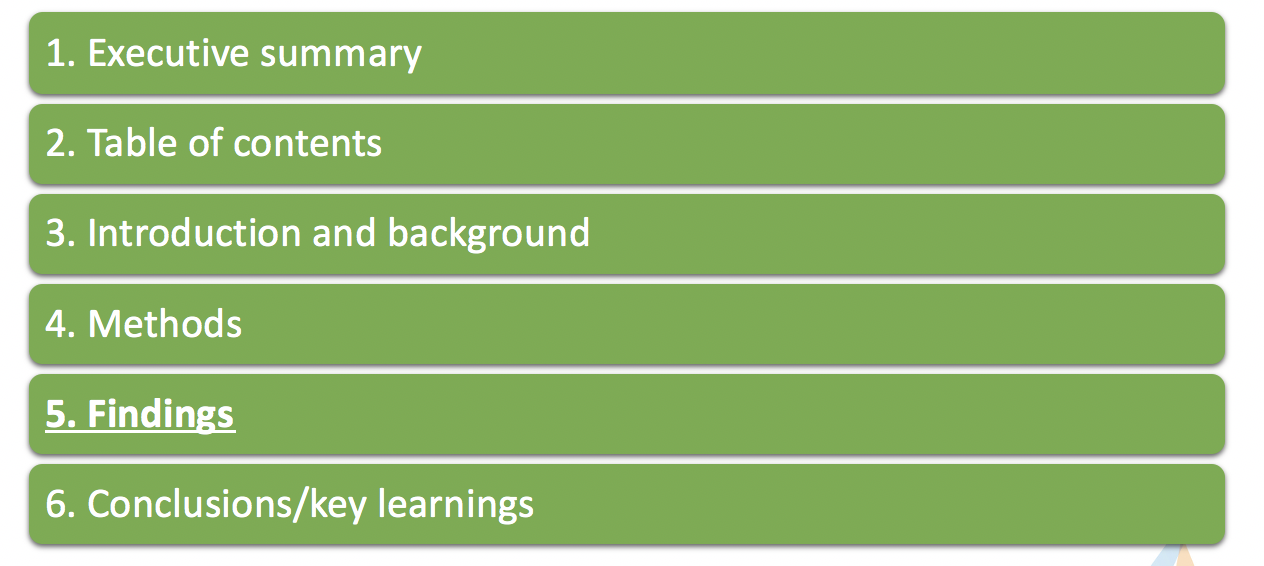
Structure of a typical evaluation report

Screenshot 2020-04-17 10.22.25.png

In this post I will focus mostly on the FINDINGS section.  However, below are my top tips for writing the other sections. 

1. Executive Summary

What is it? A short standalone section (2-3 pages), considered to be a condensed version of the report.

  • It should summarise the purpose, key findings and conclusions of the evaluation

  • Spend time on this because many people only read this and not the full report

  • Write it at the end once you have completed all the other sections

2. Table of contents

What is it? A list of headings and page numbers

  • Ensure your headings are easily scannable. It will help guide the reader through the key findings

3. Introduction and background

What is it about? States the evaluation purpose and key questions e.g. did your program deliver the outcomes you expected?

  • Here is where you include background information for context i.e. a brief description of the program and who it is for

  • It should also include a summary of intended goals e.g. theory of change and evaluation framework (include appendices if helpful)

  • Keep it short and concise. Avoid lengthy descriptions of the program

4. Methods

What is it about? Outlines the research methods used e.g. qualitative/quantitative

  • Be sure to describe any limitations with the methodology

  • It is important to be transparent and accurate e.g. if you didn’t get the response rate you were expecting, just state this up front and explain what it means for the results e.g. they are indicative only, further research is required, but the results are still useful to help us x, y, z.

5. Findings

What is it about? An organised summary of your data in a way that describes whether and how well the program has met its intended goals. 

  • This is where you include your data analysis and key insights i.e. you describe the data and interpret what it means

  • Use your evaluation framework to help structure this section

  • For more information see ‘how to write a findings section’ see below

6. Conclusions

What is it about? This section should include the main things you have learned

This may include a list of suggestions for modifying the program (recommendations) or questions the findings have raised e.g. did it challenge your thinking or Theory of Change?

For more great practical tips I find these sites really helpful:

How to write the findings section?

The findings section is important because it provides the backbone for the rest of the report. 

It’s easy to go down wormholes when writing this section. You may be tempted to ask lots of questions of the data as you analyse it. That’s fine, but try to keep in mind the ultimate question you are trying to ‘answer.’

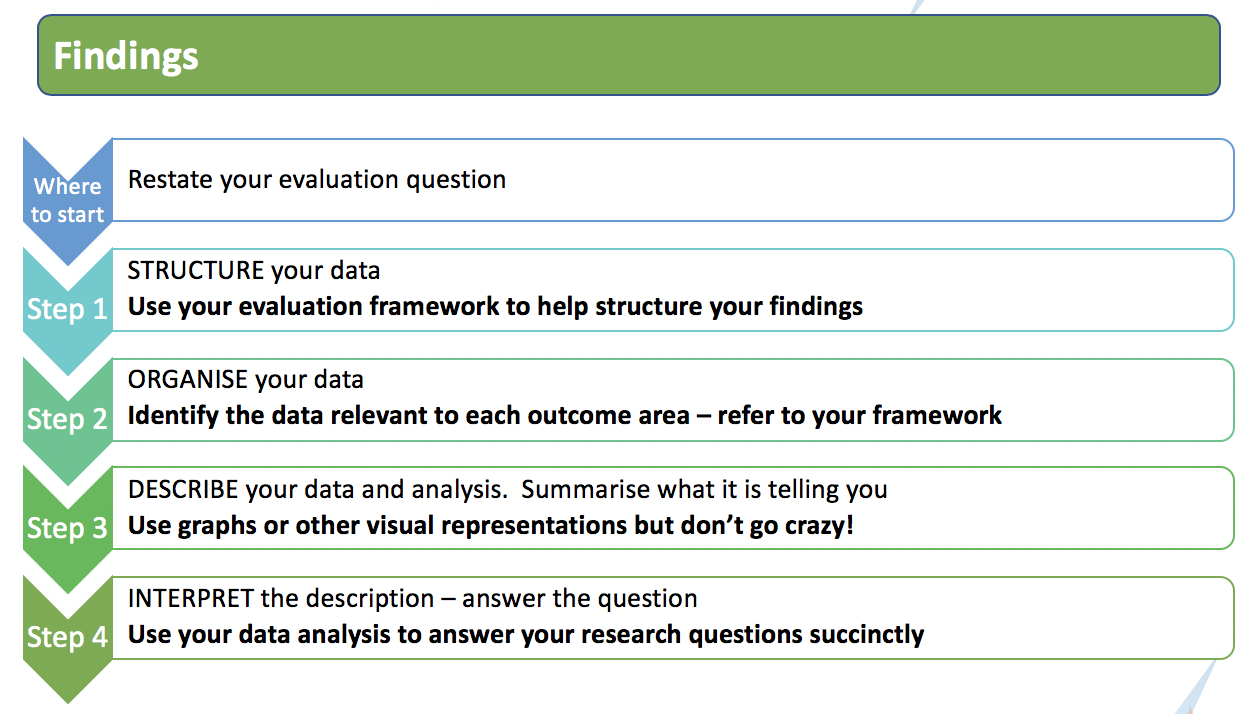
The diagram below provides some steps to help you navigate your way through the ‘findings’ sections, particularly is you are doing it for the first time.

Screenshot 2020-04-17 10.26.29.png

Where do I start?

It is a good idea to begin this section with an introductory statement to help remind the reader (and yourself) about the key evaluation question. This will keep you focused. 

For example:

The key question examined in this report is:

  • Did ‘Project X’ deliver the outcomes we anticipated it would for participants?

In this section we give an assessment of the extent to which ‘Program X’ delivered the outcomes defined in our impact evaluation framework.

We have examined outcomes in the following outcome areas:

  • X

  • Y

  • Z

  • Unexpected outcomes

Step 1 – 2 (Structure and Organise)

Use your evaluation framework to structure and organise the data you have collected. This simply means:

  • Step 1: use the outcomes defined in your framework as headings in your report

  • Step 2: identify any data you have collected that is relevant to each outcome and organise it under those headings (some may be relevant to more than one outcome)

Step 3 – 4 (Describe and Interpret)

The next step is to describe what the data is telling you about those outcomes and try and interpret what it means. 

Be sure that it is clear when you are describing something as opposed to when you are interpreting it. 

Tops tips

  • Keep it succinct and use plain English - avoid acronyms and technical language

  • Don’t forget to include a section on ‘unexpected outcomes’

  • Use comparison data or contextual data where possible to give your results meaning

  • Where appropriate use data visualisations to bring your results to life e.g. graphs, info graphics etc.

Below is an example to help illustrate steps 1-4 working through the outcomes articulate in a sample evaluation framework.

Helpful online tools

Here are some handy free and low cost tools I have used in the past to help with reporting writing.  There are lots out there.  Find the ones that you like and work best for your needs. 

Sample size calculators – great to help you understand how many people you should survey (in the design stage) and how confident you and your readers can be in your results. One I have used in the past is:

https://www.surveysystem.com/sscalc.htm 

Word Cloud’ generators – help you visualise common words used in open text responses. One I have used in the past is:

https://worditout.com/

Data visualisation software – great for producing engaging graphs and other graphics.  Helps bring your results to life. One I have used in the past is:

https://infogram.com/

Ethical considerations in reporting

There are ethical considerations to keep in mind when you are designing your evaluation and collecting data.  But there are also important ethical considerations to think through as you report your results.  Sometimes these are not always obvious. 

Here are some things to keep in mind when you are writing up your report.

For more information on ethics in reporting visit: https://www.aes.asn.au/images/stories/files/membership/AES_Guidelines_web_v2.pdf

1.   Be accurate and transparent

For example:

  • Report negative findings – it can be confronting to see negative results, especially when doing self-evaluation.  But you mustn’t hide them.  Instead, use it as an opportunity to reflect on what worked, what didn’t, consider whether your assumptions were right etc. Funders don’t expect to see perfect results.

  • Be clear about the limitations of your data e.g. be open about your sample size and what it means for your results. If you have a small sample size say so.  Don’t claim it is representative.  Instead talk about how results are indicative or illustrative only.  Talk about how the results should and shouldn’t be used. Use a sample size calculator to generate a margin of error. 

2.   Don’t overstate your findings

For example:

  • Unless you have 100% response rate don’t say ‘all participants’ think this….say ‘people we surveyed’ or ‘respondents’ instead.

  • Don’t use language like ‘this result proves this.’ Try words like ‘indicates,’ ‘suggests’ etc. instead. 

  • Don’t use percentages if the sample size is low. Use counts instead.

  • If low counts compromise anonymity/privacy consider combining categories and aggregate responses e.g. disagree/strongly disagree

3.   Maintain confidentiality and anonymity

For example:

  • Always double check you have consent before using quotes or any other identifying data.

  • Sometimes, because of the sample size or other factors, it may be possible to identify a participant even if they don’t provide their name e.g. their age, organisation or other information they provide might identify them. 

  • If this is the case, and you really want to use a quote, always check first with them before you use the quote etc.

4.   Avoid bias

It is always important to check for bias, but especially so when conducting self-evaluations. For example:

  • Always be aware of own biases, pressures, personal background, values and assumptions. Make them explicit in your report

  • Give your report to someone else to read to check for possible bias (sometimes it is hard to see your own biases)

5.   Don’t use disempowering language

Be aware of the potential effects of differences and inequalities in reporting, especially those related to race, age, gender, sexual orientation, disability, religion, socio-economic or ethnic background etc. For example

  • Don’t label people in reports e.g. call participants ‘disadvantaged people.’

  • Think about it from their point of view and how they would feel reading the report.

  • Get advice if you are unsure.


Communicating results

Communicating evaluation findings

You’ve collected all your data, you’ve analysed it and you’ve written the report.  Job done?

Well that depends. 

There are few more questions to ask yourself? For example:

  • Are my key stakeholders likely to actually read my report? 

  • If my results are persuasive, will a report alone do the trick in getting the word out?

Usually, in my experience, the answer is, ‘probably not.’

That’s why it is really important, from the very beginning (if possible), to think about how you’d like to communicate your results. 

Why it is important

A lot of time and effort goes into conducting evaluations.  Thinking through how you will communicate your results will help you get the most ‘bang for buck’ out of that effort. For example:

  • You may have useful lessons to share with the project team and/or the sector

  • You may have some compelling or persuasive statistics or stories that could be used to support things like:

    • brand building

    • fundraising

    • influencing (policy-makers, senior management etc.)

But don’t confuse evaluation with advocacy. Evaluation results can be used to support advocacy but it mustn’t drive this work (more on that later).

What kind of communication materials are there?

Good communication materials pull key information from your report and present it in an engaging, accurate and easy to understand manner.

Common materials include:

  • Executive or Summary findings

  • Fact sheets

  • Infographics

  • Video presentations

  • Content for web or social media campaigns

  • Conference presentations

  • Articles, press releases etc.

Ethical considerations in communicating results

When using findings out of the context of the report it is really important to be ethical.  All the same ethical considerations apply as when you report your results (See Tips for Writing an Evaluation Report).  But it is also important to think through how they apply to the new context in which you are reporting.   

There are also some other considerations you may need to think through. For example:

  • Don’t cherry pick only positive results

  • Don’t confuse advocacy with evaluation activity. For example:

    You can use evaluation findings to support advocacy but it shouldn’t drive this work. You must create a safe space for people to tell you confidentially about their experience good or bad. 

For example, if you want to bring your results to life with interviews that’s OK, but do it as a separate exercise to any interviews you have planned for the evaluation.  Interviewees might feel pressure to tell you only stuff they think you want to hear on camera (i.e. social desirability bias).

For your inspiration…

There are many examples of great communications materials out there for your inspiration.  You have probably come across many yourselves.

Here are some examples that inspire me….

Helpful tools

Here are some handy free and low cost tools I have used in the past to help with producing communications materials for evaluation results.  There are lots out there.  Find the ones that you like and work best for your needs. 

Free/low cost graphic design software: provides great adaptable templates for reports, infographics, social media infographic templates etc.

Two I have used in the past are:

Explainer video software: provides great templates for designing video presentations

One I have used in the past is:

This video gives examples of these tools in action

How do I decide what is necessary?

Start by developing a communication strategy, sometimes known as a dissemination plan. It will help you identify the best methods to communicate your results and the resources you’ll need.   

Tops tips

  • Don’t do everything

  • Prioritise the things that will resonate with your audience

  • Allocate budget and time to do these tasks e.g. photographer, videographer, software, graphic designer etc.

  • Assign responsibility

  • Build in time for learning design software.  It is designed to be user-friendly but it is easy to get carried away!

  • Put your plan together asap because you may need to collect materials during your project (in addition to research data) e.g. photos, video etc.

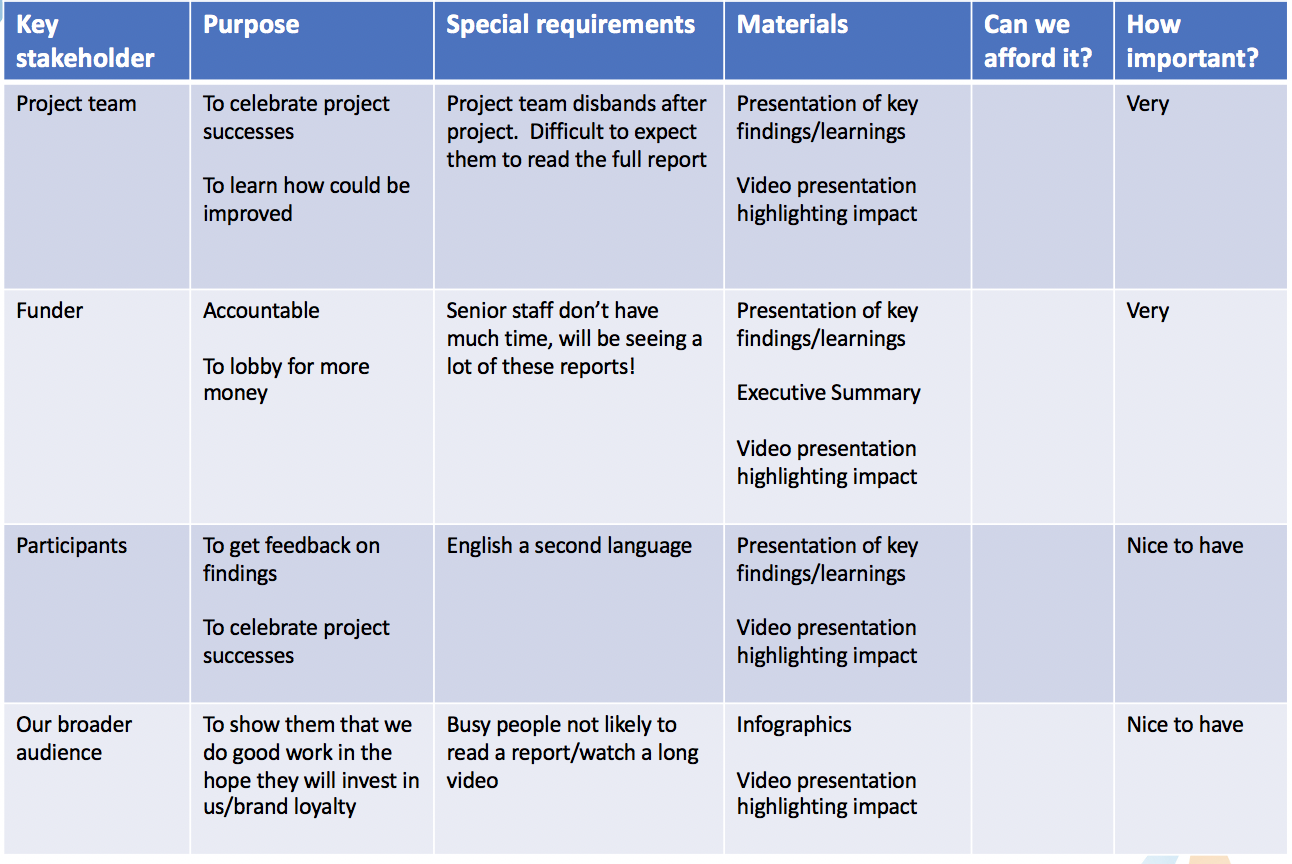
The diagram below steps you through a dissemination plan if you are doing it for the first time.

Screenshot 2020-04-17 14.05.58.png

Step 1. Identify your audience

The first step is to work out who you want to communicate your results to.  This might include the following stakeholders:

  • The project team

  • Funders

  • Participants

  • Your followers

Step 2. Articulate why you want them to know about your results

Spelling out why you want each group to know about your results will help you work out what materials are going to be most suitable.  Some reasons might include

  • Celebrating the project

  • Accountability requirements

  • Advocacy

Step 3. Identify any special requirements

The next step is to think about whether anyone has any special requirements.  For example:

  • Are you dealing with time-poor people who won't have time to read a report?

  • Is English a second language for some stakeholders? Would they respond better to audio visual materials etc.?

  • Do any stakeholders have accessibility requirements?

  • Do some of you stakeholders have stakeholders of their own e.g. your Executive might need to report to the board, what kind of materials might be useful for them?

Step 4 - 5. Identify appropriate materials and resources you’ll need

Steps two and three will help you work out which are the most appropriate materials for each group i.e. the materials they will respond to and will meet their needs.

That final step is to work out which materials to prioritise and whether you can afford it.

Can I have a template?

Why yes!  Here is a template that I have used in the past.  It also includes a worked through example.

Evaluation results dissemination plan template

Screenshot 2020-04-17 14.08.14.png
Screenshot 2020-04-17 14.08.24.png

Qualitative Methods - A Non-Exhaustive List

Sometimes, people shy away from qualitative methods, thinking that they are only descriptive and don’t give you “hard” data. In fact, you can use qualitative methods to gather deeper insights, as well as to derive quantitative outcomes. All you need is the right questions and the right coding techniques.

In this section we look at some key qualitative methods:

  • Observation

  • Interviews and focus groups, including how to code results

  • Arts-based evaluation

Observation

Screen Shot 2020-02-11 at 9.36.05 am.png
Play Me, I’m Yours, Artist: Luke Jerram, Arts Centre Melbourne 2014. Source: Bailey & Yang Consultants (2014) Play Me, I’m Yours Project Evaluation (Betty Amsden Participation Program), Arts Centre Melbourne, Melbourne

Play Me, I’m Yours, Artist: Luke Jerram, Arts Centre Melbourne 2014. Source: Bailey & Yang Consultants (2014) Play Me, I’m Yours Project Evaluation (Betty Amsden Participation Program), Arts Centre Melbourne, Melbourne

Observation: Pros and Cons

Screen Shot 2020-02-11 at 9.40.03 am.png

Observation: Steps

Screen Shot 2020-02-11 at 9.40.49 am.png

Observation Form: Example

Screen Shot 2020-02-11 at 10.13.29 am.png

Interviews and Focus Groups

Interview styles can range from open-ended through to quite formally structured. We tend to conduct semi-structured interviews, using a discussion guide to make sure we cover key areas but allowing us flexibility to follow the interviewee’s line of thought. We also make sure there are a handful of key questions we ask all the interviewees to ensure we have some consistency.

With some groups e.g young people, I prefer to conduct interviews with “friendship triads” which just means groups of three people who know each other. This seems to help people bounce off each other. But one-on-one interviews are fine.

Focus groups are useful when you have to talk to a lot of people, but you do need to try to avoid group-think. We tend to limit online focus groups to 4-5 people, and in-person groups to 5-8 at the most.

Walking interviews are a useful approach when you are interested in people’s relationship to a particular place. They are also great if you want to hand the “power” back to the interviewee, so you are not in the position of expert any more, but in a position of not-knowing and learning from the interviewee.

Interview Process

The following is a rough process when using interviews to evaluate programs:

  • Stage 1: Design the interview guide

  • Stage 2: Conduct the interview

  • Stage 3: transcribe the interview

  • Stage 4: Code the interview

  • Stage 5: Analyse the codes

  • Stage 6: Report, and add illustrative quotes for key thematic findings

We ask permission to record interviews and focus groups so we can transcribe and code later. This is good to do, because it helps us avoid simply summarising our own interpretations of what people have said.

In the pre-amble to an interview, we always emphasise a few key points:

  • We ask permission to record

  • We explain that we are just here to listen and understand, and that there are no right or wrong answers

  • We ask for their frank and honest feedback, because that is the only way to improve a program

Sometimes we ask an interviewee to reflect on an experience and tell us about moments that have stayed with them. It can be useful to flag you are going to ask this “e.g. you don’t have to answer this now, but later it would be great to hear about a moment that has stayed with you, if any…”. This allows the question to simmer away in the back of the interviewee’s head so they aren’t taken by surprise.

It can also be a good idea to ask your most “important” questions towards the end of the interview. By then you have hopefully established some rapport with the interviewee.

Throughout the interview, be mindful of your body language, the noises you make, your facial expression - anything which might unconsciously bias the interviewee to try to tell you what you want to hear. A lot of communication is non-verbal. This doesn’t men you have to be deadpan - but whatever they say, you have to be ready to be sympathetic and encouraging. Your job is not to get them to answer questions in a particular way, but to let them reflect on an experience. You are like a journal, with prompts.

Coding

Coding is the thing that seems to scare people so I will run through it here. Basically, coding means reviewing the interview transcript and identifying the key themes that the person has talked about.

You’ll start out with fairly verbatim themes, then gradually, as you do more transcripts, common themes will start to emerge and you can start grouping them.

It’s a cumulative process: you have to start out allowing for a fair bit of detail in a theme, and then gradually refining it.

The way I do it: I print out the transcript and jot down on the left-hand side the category of enquiry the person seems to be talking about, and on the right-hand side I jot down the theme of what the person is saying. It looks something like the below.

What my first stage of “coding” looks like.

What my first stage of “coding” looks like.

The “themes” become the initial codes, and the “categories” become the areas of enquiry which I gather the themes against.

From here, I start to transcribe my themes into a spreadsheet which will end up being a very wide spreadsheet - the below images are examples of parts of the spreadsheet. Because a person might say more than one thing which relates to a category, you have to include multiple columns for each category.

Screen Shot 2020-02-11 at 11.05.05 am.png
Screen Shot 2020-02-11 at 11.05.32 am.png

I type in the “code”, e.g. under personal goals I might include “working with artists from overseas”. I do this for each thing the participant said. Gradually I refine the codes so they might start to cohere, e.g “work with artist from overseas” could eventually be grouped under “artistic development”.

Categories may correspond to some of the main areas of questions in the interview. However, don’t assume this is the case: there might be some unexpected comments which it is important to include and categorise.

The categories may also match up with the areas I identified as part of my impact framework. But they won’t always match up, which is why it is important to code the interviews as they are, and not attempt to code them using your impact framework language in the first instance. You have to be as objective as possible, and not subconsciously shoe-horn the interviewee’s comments into what you thought the impact would be.

Templates

Here are some templates for interview discussion guides, note templates and coding templates.

Walking Interviews

Walking Interviews were used in the “Connected Lives Project” (UK). These are examples of the routes and photos taken on two walking interviews. Source: Clark, A. Emmel, N. (2010) “Realities Toolkit #3 Using walking interviews.” Realities, part of t…

Walking Interviews were used in the “Connected Lives Project” (UK). These are examples of the routes and photos taken on two walking interviews. Source: Clark, A. Emmel, N. (2010) “Realities Toolkit #3 Using walking interviews.” Realities, part of the ESRC National Centre for Research Methods, Manchester University, UK.

Walking interviews are interviews which you do whilst walking. They are useful when you want to understand people’s relationship with a particular place. They are also useful when you want to hand the “power” back to the interviewee, so you are not in the role of “expert” - the interviewee chooses the route and may talk more comfortably in motion.

Walking Interviews: Pros and Cons

Screen Shot 2020-02-11 at 9.59.11 am.png

Walking Interviews: Steps

Screen Shot 2020-02-11 at 10.14.50 am.png

Arts-Based Evaluation

Screen Shot 2020-02-11 at 10.20.39 am.png

When you are working in the arts, it seems to makes sense to use creative tools to evaluate the impact of a program. However, it can be tricky to interpret the artefacts which participants create.

Arts-Based Evaluation: Pros and Cons

Screen Shot 2020-02-11 at 10.23.58 am.png

Arts-Based Evaluation: Steps

Screen Shot 2020-02-11 at 10.26.29 am.png

Arts-Based Evaluation: Examples

Youthrex Webinar, 2015

Youthrex Webinar, 2015

Art Jam 

Art Jams are a gathering of individuals who make art by way of collaboration, improvisation and responsiveness. Art Jams are like focus groups, but with meaning arising about an evaluation topic through the interactive mode of art-making, rather than conversation e.g. facilitators can document the jam to collect important data about the experience. 

transformational self-portraits

Participants create a series of self-portraits at different intervals of a project (painting, drawing, collage, or any other artform). 

  • Stage 1. depicts how participants see themselves, things that have influenced their sense of self and their motivation for participating in the project.

  • Stage 2. participants represent themselves in what they see as their role or contribution to the project.

  • Stage 3. participants create a portrait of how they have changed as a result of the project and /or how they imagine taking what they have learned to shape their future selves.

Screen Shot 2020-02-11 at 10.44.35 am.png

Before and After Tool

We use this quite a lot, especially with kids and young people. We ask respondents to reflect on how they were before the activity and afterwards. Then we code the responses according to emotional valence and arousal, to see if there has been an overall change in mood amongst participants.

Use this Before and After Coding Spreadsheet Template to code responses. You can also use this type of spreadsheet to code the transformational self-portraits.

Sources

Better Evaluation, Collect and/or Retrieve Data, Better Evaluation.

Burns, L. Frost, J. (2010) Arts informed evaluation: A Creative Approach to Assessing Community Arts PracticesArts for Children and Youth Toronto, VIBE Arts, Canada.

Clark, A. Emmel, N. (2010) “Realities Toolkit #3 Using walking interviews.” Realities, part of the ESRC National Centre for Research Methods, Manchester University, UK.

Daykin, N.(2015) ”Creative and Arts Based Evaluation Methods.” Credible and Credible.

Kinney, P. (2017). “Walking Interviews” Social Research Update. Issue 67, Summer. University of Surrey. 

Macfarlane, A. (2017) “Non-Participant Observation” Better Evaluation, Sharing information to improve evaluation, the Australia and New Zealand School of Government (ANZSOG), Melbourne.

Searle, M. (2016) “Capturing the Imagination: Arts-Informed Inquiry as a Method in Program Evaluation,“ Canadian Journal of Program Evaluation Spring: 34-60.

Spicksley, K. (2018) “Walking interviews: A participatory research tool with legs?” The Bera Blog.  Research Matters British Educational Research Association.

Van der Vaart, G. van Hoven, B. and  P.P. Huigen, P. (2018) “Creative and Arts-Based Research Methods in Academic Research. Lessons from a Participatory Research Project in the Netherlands” FQS Forum: Qualitative Social Research Volume 19, No. 2, Art. 19 – May.

Wang, Q. Coemans, S. Siegesmund, R. Hannes, K.(2017) ”Arts-based methods in Socially Engaged Research Practice: a Classification Framework”. Art/Research International: A Transdisciplinary Journal. 2017;2(2): 5–39. 

Wimpenny, K. and Savin-Baden. M. “Using Theatre and Performance for Promoting Health and Wellbeing Amongst the 50+ Community: An Arts-Informed Evaluation,” The International Journal of Social, Political and Community Agendas in the Arts, 8(1): 47-64.

Surveys101

Surveys are a blunt tool, but they are good for getting an idea of what a large number of people think about your project, and the impact your project has had on them.

Survey Basics

Surveys101.png

The following diagram sets out the flow-chart of things to think about and do when designing and analysing a survey.

Step 1: Assess the feasibility of a survey

Before you even decide to run a survey, ask yourself - do I have the time, money and access to the respondent population to run a survey?

Is the population big enough to warrant a survey, or am I better off with a handful of interviews?

You can calculate the size of the sample you will need to obtain a margin of error of say, 10% or less. This means that your results can be read within a margin of + or - 10%. I use this free sample calculator to find out if I have a big enough sample, or to work out the minimum number of responses I need to get a margin of error of no more than 10%.

If your population is less than 100 - e.g. a small group of 20 participants in an arts workshop - then you might want to consider doing a series of interviews, or a focus group conversation. You can still run a survey, but unless you get almost 100% response rate, you will only be using the results as descriptive or indicative - you will not be able to say the results are representative of the whole participant population. And that’s fine - as long as you qualify upfront what your results do, and do not, tell you.

Consider how you will reach your respondent population at this stage. Do you have their email addresses? Will you need to have people on the ground with iPads or clipboards, collecting email addresses or asking the survey questions on the spot?

Step 2: Conduct qualitative research to inform the survey

If you have the time and resources, we always advise conducting some qualitative research to inform the survey design. That way you can use the language of your respondent population in the survey.

For example, once I wrote a survey question for a group of year six students. I used the term “It pushed me out of my comfort zone.”

I was lucky to have the chance to talk to some students before I sent out the survey, and when I tried this sentence out on them, I was met with blank stares.

But what the students said which meant something to them was, “It was hard but worth it.” I would not normally use a phrase like that in a survey because it has two concepts in it at once - but for the students, “hard but worth it” was a single concept which worked.

Step 3: Design the sample

Some questions to ask when you design the sample (which just means, when you work out who you are going to send your survey to):

  • Am I using a sample or am I really needing a census? (You’ll want to collect close to a census if the group is small, e.g. less than 20).

  • Sample structure e.g. random, constructed - are you going to target specific participant types based on the priorities of the project, or are you going to randomly construct your sample? Typically our sample self-selects based on who answers the survey, but if you can, you should try to target groups which are typically under-represented in samples e.g. people from culturally and linguistically diverse backgrounds, people with disabilities. For these groups, set aside some resources to do interviews or directly survey people.

  • Consider the estimated demographics and size of population, which will affect how you recruit so as to get a representative sample.

  • Think about the burden already on these participants when it comes to being over-researched. Many target groups have research or survey fatigue, so think about whether you really need to survey them or if you can make it as easy as possible for them to share their feedback. Take as much of the burden on yourself as you can.

  • Recruitment method – how will you get respondents? Print out surveys handed out at an event? Collecting email addresses? Social media promotion?

  • Confidence interval – use a sample size calculator to work out your margin of error, or the “confidence” with which you can rely on your results to be representative.

  • Focus on people from the target populations you hope your project was going to change (but still sample across the spectrum).

Step 4: Design the survey

When you design the survey, you have to think about how to avoid bias as much as you can. One way I like to think about it is, what questions would I ask if I was trying to prove that my project did not work?

Click here to see an example participant survey we have prepared.

Avoiding bias

Example of reframing a statement in a survey.

Example of reframing a statement in a survey.

Some types of bias include:

  • Social desirability bias – tendency to answer in a way the respondent deems more socially acceptable than their ‘true’ answer. Can include taking unspoken social cues from the researcher

  • Cultural bias – desirability of certain responses as seen through as particular cultural lens; cultural understanding of certain terms

  • Acquiescence bias – tendency to answer yes

  • Demand characteristics – tendency to adapt behaviour because of a desire to be a ‘good’ experiment subject - attempt to work out the hypothesis, and alter behaviour or response in order to support the hypothesis

  • Question order bias – the way you order questions can affect responses e.g. if an earlier question creates an unintended context for later questions / answers to later questions are affected by what the respondent thinks would be fair given their response to the earlier question.

Question design

E

E

Things to keep in mind when designing your questions:

  • Use language that makes sense to your target sample

  • Ask for firsthand experiences

  • Ask one question at a time (e.g. don’t ask “Was it fun and enjoyable"?

  • Ash the question last in the sentence.

  • Provide memory aids.

  • Ask demographics towards the end of a survey (because this is the most personal information you ask for, so you should build up trust before you do).

Screen Shot 2019-12-03 at 3.48.50 pm.png

Response types

Often you will see surveys use the 5- or 7-point Likert scale. You know the scale - Strongly agree . Agree. Neutral. Disagree. Strongly disagree.

This is great for samples of more than 100, but if you have a small sample, we recommend sticking with a Yes/No/ N/A response scale. Otherwise you will end up in the analysis stage, simply adding together your Strongly Agree + Agree responses and so on, because you didn’t get enough responses to make meaningful comments at the five-point response level.

Try to use the same scale throughout the survey if you can. We tend to use the Yes/No/N/A, and then at the end of the survey we might add in a “score out of 10” question for an overall evaluation.

Also try to limit the use of open text fields. We tend to include one, sometimes two, open text questions in a survey. Analysis is more complex the more open text fields you have, and also they can slow down the flow of a survey. We also find that people tend to have one main thing they want to say and they will say it and then feel the pressure to re-word and repeat it in all the other open texts.

Step 5: Test the survey

Test the survey with a small group of respondents before you roll it out. That way you can check your language and make sure the survey software works.

Screen Shot 2019-12-03 at 4.05.30 pm.png

Step 6: Implement the survey

Implementing the survey does not end with sending it out to your email database. You need to check your response rate whilst the survey is in the field, and make sure you are getting enough responses from across the demographic spectrum of participants. Chase people and encourage people, offer incentives if you can, and if you are not getting a representative sample, spend some time on the phone, directly asking the survey of people from the under-represented groups.

Step 7: Analyse the results

At this stage you will be glad you included demographics which directly relate to the types of groups you might expect to have different experiences. This might be men / women / non-binary, or it might be age range, but it might also be something like level of arts participation .e.g. people who don’t participate in arts regularly compared to people who do might have different results.

Check validity

You also check the validity of your survey at this stage.

  • Compare the results against qualitative findings, or findings from other sources e.g. anecdotal feedback, participant journals.

  • Check if the same respondent has doubled up on positive and negative responses (e.g. agreed with the statement that the project was fun and then with a statement that the project was not fun).

  • Check that there is distribution across the response scale, otherwise you might have designed a survey which pushes people to consistently answer yes or no.

Screen Shot 2019-12-03 at 4.06.23 pm.png

Step 8: Report on results

Share your results with the respondents if you can. It is part of the relationship of mutual give and take you have with your participants, and it is also because the data really belongs to them as much as you.

Step 9: Further qualitative research

The survey hopefully throws up some unexpected outcomes. Make sure you have set aside a bit of time and money to conduct some interviews or conversations digging deeper into some of the unexpected outcomes, the key outcomes, or the experiences of people under-represented in the survey responses.

Introduction to quantitative and qualitative research methods

We recommend that arts companies use a mix of narrative and numbers when telling the story of impact. This means gathering two main types of data:

  • Qualitative data - this generally refers to the findings from observations, interviews and case studies (although once you code interviews, you can translate this into quantitative data - more on this later)

  • Quantitative data - this refers to findings from surveys, questionnaires, and economic proxies for impact (e.g. quantifying impact in dollar terms)

By using both narrative and numbers, you can communicate to people who respond to stories and people who respond to figures.

It can be time-consuming and takes a degree of expertise to deliver a robust and trustworthy data set. 

So ask yourself:

  1. What are we trying to measure, and why?

  2. How will we use the data we collect?

  3. Is a quantitative approach the best method to achieve what we need?

  4. Is there an existing, validated survey we can use?

Screen Shot 2019-12-03 at 3.11.19 pm.png
Screen Shot 2019-12-03 at 3.03.08 pm.png
Screen Shot 2019-12-03 at 3.08.24 pm.png
Screen Shot 2019-12-03 at 3.09.07 pm.png

Free Evaluation Tools

We have developed a number of free resources for evaluation of projects. Here you go!

Evaluation framework template

This is a spreadsheet which you can use as a basis for developing your own process evaluation framework, outputs framework and impact evaluation framework.

Survey Templates

We have collated a number of questions from a variety of publicly available instruments in the one place. We have also included the types of questions which we have developed and used over the last ten or so years to evaluate the arts experience, because this is at the heart of any other types of impact which arise from an arts project.

Participant Survey Template

We have put together an example of the types of questions you might include in a participant survey for an arts project. We have included questions from impact categories such as connection, self-efficacy, artistic experience and integrity of process. Feel free to use and repurpose! We ask for attribution and share these resources under Creative Commons non-commercial licenses.

Qualitative Tools

Here are additional tools including interview guides, permission forms, and qualitative data analysis templates. The Star Selfie is provided by Big hArt.

Interview Guide - Example

Interview Summary Notes - Template

Interviews - Spreadsheet for Analysis - Template

Before and After Reflection Tool - Spreadsheet for Analysis - Template

Permission Form - Template

Ways to think about impact

There are a number of ways to think about impact. Here are some of the ones we use regularly.

The BYP Group “hearts, minds and bodies” model of impact.

Screen Shot 2019-09-27 at 3.17.11 pm.png

This model helps us think in very concrete, real world terms about how a project makes people feel (hearts), think (minds) and what they do (bodies). We include ‘society’ because there is also a relational element to change - how your project affects the way people relate to and are in the world around them.

BYP Group’s relational model of impact

Screen Shot 2019-09-27 at 3.18.30 pm.png

At its core, art can be understood as part of a web of relationships - between art and itself, art and maker, art and audience, art and participant, participant and participant, maker and community, society and art, and so on. This is also a useful way of thinking about the impact of an arts experience, and also helps remind you of the various groups you might be influencing (and the impact you may want to measure for different groups).

A First Nations’ perspective on self and determinants of wellbeing

FN-model-of-impact.png

This diagram is a “conception of self grounded within a collectivist perspective that views the self as inseparable from, and embedded within, the family and community.” © Gee, Dudgeon, Schultz, Hart and Kelly, 2013 Artist: Tristan Schultz, RelativeCreative.

Levers of change

I like to think about the levers we have to effect social change, or impact. In very broad brushstroke terms, we can think of the ways we try to change society as interventions at the individual/community level, and interventions at the societal level.

At the individual/community level, we might conduct arts projects and skills building programs which try to change society by empowering individuals, and sometimes communities, to change their own lives. This is typically the level at which arts organisations operate.

At the societal level, we might seek legislative or regulatory change e.g. minimum wages, a four-day working week, tobacco taxation, gun laws. This is the level that organisations like Get Up!. trade unions, or Amnesty International typically operate.

I like this model because it reminds us that we are operating in a larger context, which affects the success of our projects. For example this means that we can’t measure the success of an arts project by the number of jobs participants get afterwards - we can only look at their job readiness, or how many more applications they might make.

It also reminds us of our sometimes unexamined assumptions about the power of the individual to change the world, which can be quite a Western, coloniser concept (very Ayn Rand…). We can all benefit from looking at the broader context which individuals inhabit - the Bourdieusian “fields” which they operate within, and which limit / shape / create sources of power.

Public Value

‘Public value’ is another way to think about your impact. Here is a webinar I gave for the Australia Council for the Arts about how to measure and understand your public value.

START HERE: The basics of social impact evaluation

What is social impact? How do you measure the social impact of creative industry interventions?

We have put together an overview of the basics for social impact evaluation in the arts and creative industries. It includes some basic introductory information on:

  • Methods for developing an M&E framework

  • Examples of indicator frameworks

  • Tools for collecting data

Slide7.jpeg

Does my project have the qualities that are ALREADY KNOWN to contribute to social impact?

Did the participants in my project experience the kinds of change which are KNOWN DETERMINANTS of social impact?

How do you know if the answer is ‘yes’ or ‘no’ or ‘maybe a bit’? That is the focus of most of the evaluation resources on our website.

  1. Develop a Theory of Change (what you think is going to change because of your project) and understand the impact you want to achieve

  2. Develop an evaluation framework (this includes the impacts, outputs and process aspects of your project)

  3. Develop the tools for data collection (interviews, surveys, questionnaires, arts-based tools…)

  4. Analyse, and share results

See the evidence resources on our website for references and findings about what leads to social impact.

Impact Evaluation Framework

How do you know if your project has led to change?

In an impact evaluation you look to see if:

  • The project has the qualities of arts activities which are known to contribute to social impact

  • The participants have experienced change in their skills and knowledge, emotions, attitudes and behaviours which are known determinants of social impact

Screen Shot 2019-09-27 at 2.46.31 pm.png

Arts activities known to contribute to social impact have the following qualities:

Screen Shot 2019-09-27 at 2.47.47 pm.png

The arts experience should engage people on cognitive, behavioural and emotional levels:

Screen Shot 2019-09-27 at 2.48.10 pm.png

The project should also contribute to the determinants of individual, community and social change:

Screen Shot 2019-09-27 at 2.51.30 pm.png

How do you measure whether your arts activity has these qualities and contributes to the known determinants of change? You evaluate!

You need to develop an evaluation ‘framework’ for each of your target groups (the people you want to experience change). These could include:

  • participants in the project

  • audience or visitors to the project

  • donors and funders

  • community members, local business owners

  • the general public

Below is an example of an evaluation impact framework for participants in a project. Note that for every group, you must evaluate the arts experience because, as we said above, that is at the heart of any impact.

The example below just shows some of the types of impacts your project might aim for. If you can, you should talk to your participants or audience members and use their language and ideas to inform your framework.

As you go along with the project you might change this framework because you find out you are having different impacts to the ones you expected. That’s OK - an evaluation is not an exam that you get wrong or right! It’s a process for understanding and measuring the change your project might have.

Screen Shot 2019-09-27 at 2.53.33 pm.png

Process Evaluation

In a process evaluation you look at the variables which affect the overall implementation of your project and its impact. For example, you might look at the quality of partnerships; the logistical issues; accessibility of the project; unforeseen circumstances which may affect the project e.g. weather for outdoor events, or changes in legislation which affect the feasibility of the project.

Screen Shot 2019-09-27 at 2.30.16 pm.png

Outputs Framework

As part of your evaluation, you will need to capture the nuts and bolts of your activity - what you did and who you reached. I use a simple table for capturing this information, as below. You might want to incorporate this information in your impact framework. That’s fine! I do it separately so that I a) don’t confuse my outputs with my impacts and b) don’t forget to collect this information.

Screen Shot 2019-09-27 at 2.27.14 pm.png